In my last post, it was not only about Spring Batch but also it was about some gsm concepts. With this post, I’d like to merge those gsm concepts with some navigational stuff and show you how I had drawn that map by using google maps api and some other js libraries.
Beam width was mentioned in the previous post, it was said to be the angle between the edges (blue lines) of serving cell’s signal. You may have wondered, how is this angle being calculated?
Most cells (base stations) transmit their signals to a direction, except some indoor cells which transmit their
signals all around (360o). These signals will lose their power eventually after some distance.
The points between C and X have zero power, just like the points between C and Z.
The angle between the lines |CX| and |CZ| is called beam width (mainly null to null beamwidth)
which is 80o. There is also another one called half power beamwidth, but it’s for another day.
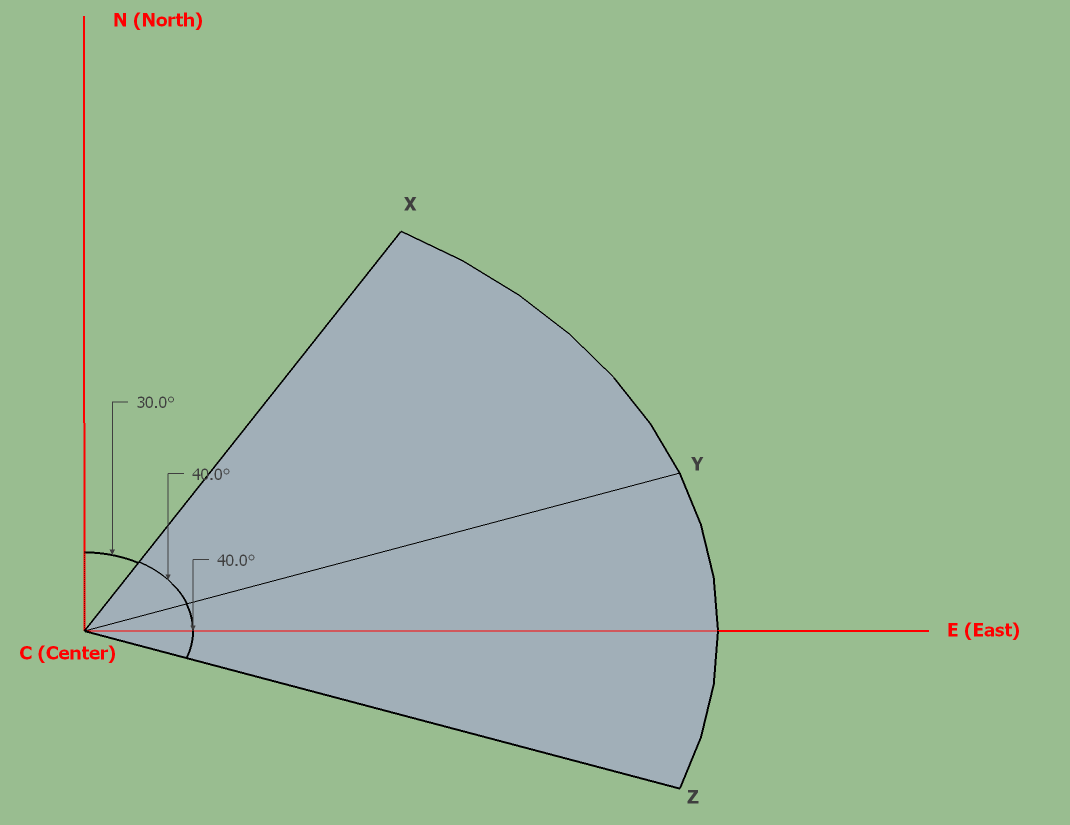
Note: Assume that there is a cell in point C. You can download original Sketchup file here
There is beam width, but one more angle is required, which direction does the cell transmit? Does it transmith north, south, north-east etc? The direction is called the azimuth of the cell, which is 70o in the figure above. The azimuth here is always referenced to the real north.
Let’s say, |CX| is 3 km long and the geographical coordinates (assuming you know what latitude and longitude are)
of C is known, is there a way to find the coordinates of X? Of course there is! Scientists have already determined it many many years ago.
In order to find the coordinates of X, one more argument is needed; absolute bearing, which is the clockwise angle (it is 300 in the figure)
between our target (X) and north.
In order to draw the figure (it may be called an arc) above in a map, some support is required.
To calculate the coordinates of X, I used a javascript developed by Chris Veness.
function destination(from, bearing, distance) {
	return from.destinationPoint(distance, bearing);
}

var c = new LatLon(-33.894582, 151.239057);
var bearingX = 30; // degrees
var bearingZ = 110; // degrees
var distance = 3000; // meters

function initialize() {
	var x = destination(c, bearingX, distance);
	var z = destination(c, bearingZ, distance);
	drawMarker(x.lat, x.lon,
		'X', markerX);
	drawMarker(z.lat, z.lon,
		'Z', markerZ);
	drawMarker(c.lat, c.lon,
		'Cell', markerC);
	centerMap(x, z, c);
}
You can find the source codes in here.
C, X and Z variables are the coordinates from the figure above and calculated by the script written by Chris Veness. (see destination function)
Calculating the coordinates is not enough, because there’s no easy way to draw an arc in google maps api; but since an arc is still a polygon,
we have a chance to draw it.
If we calculate each coordinate between X and Z by incrementing the bearing from bearingX to bearingZ (30 and 110 here)
and then use these coordinates to draw a polygon, who knows? Let’s give it a shot!
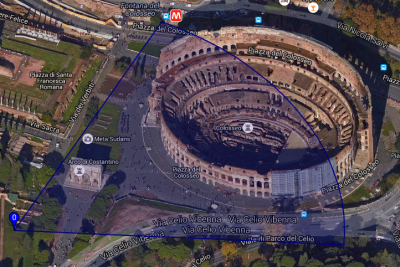
That’s what has been done in a sample here, you can check it for more.
Function polygonCoordinates below is just doing this calculation, but please note that on line 9,
coordinates of C has also been added. See it for yourself, what happens if you don’t add it.
function polygonCoordinates(start, end, lat, lon, distance) {
	var center = new LatLon(lat, lon);
	var destination;
	var points = new Array();
	for (i = start; i <= end; i++) {
		destination = center.destinationPoint(distance, i);
		points.push(new google.maps.LatLng(destination.lat, destination.lon));
	}
	points.push(new google.maps.LatLng(lat, lon));
	console.log('polygon coordinates are ' + points);
	return points;
}

function initialize() {
	var X = destination(C, bearingX, distance);
	var Z = destination(C, bearingZ, distance);
	drawMarker(X.lat, X.lon,
		'X', markerX);
	drawMarker(Z.lat, Z.lon,
		'Z', markerZ);
	drawMarker(C.lat, C.lon,
		'Cell', markerC);
	centerMap(X, Z, C);
	drawPolygon(polygonCoordinates(bearingX, bearingZ, C.lat, C.lon, distance));
}
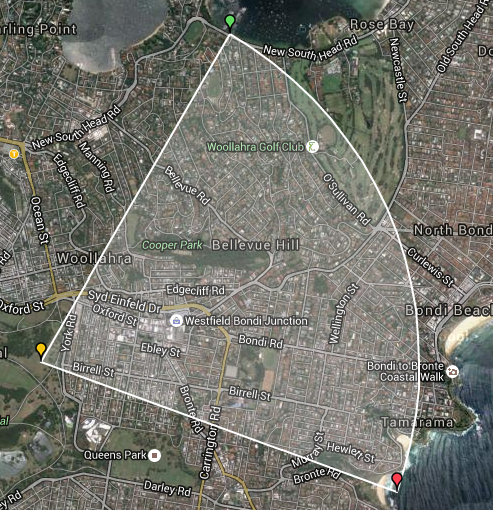
Finally, here is the result, you can see orange marker as C, green marker as X and red marker as Z.